Blog
-
Geiger Readings for Aug 12, 2018
Ambient office = 119 nanosieverts per hour
Ambient outside = 68 nanosieverts per hour
Soil exposed to rain water = 66 nanosieverts per hour
Peach from Central Market = 100 nanosieverts per hour
Tap water = 69 nanosieverts per hour
Filter water = 63 nanosieverts per hour
-

Geiger Readings for Aug 11, 2018
Ambient office = 90 nanosieverts per hour
Ambient outside = 100 nanosieverts per hour
Soil exposed to rain water = 95 nanosieverts per hour
Beersteak tomato from Central Market = 71 nanosieverts per hour
Tap water = 102 nanosieverts per hour
Filter water = 91 nanosieverts per hour
Halibut – Caught in USA = 115 nanosieverts per hour
-
Nuclear Reactors 601 – History Of Uranium Production In The U.S. – 2 of 4 Part
Part 2 of 4 Parts (Please read Part 1 first)
In addition to the competition from the Russian weapons grade ore in the 1990s, a wave of deregulation led to the development of a competitive power market in many parts of the country that would drive nuclear power out of the energy market. In the 1990s, the U.S. government privatized the Department of energy’s uranium enrichment operations. Forty-five thousand metric tons of uranium were transferred to the new private company that was created. In the early 2000s, U.S. uranium production reached its lowest level since the 1950s.
In the early 2000s, the nation of Kazakhstan, one of the old Soviet states, began developing uranium mining. In a few years, it became the biggest uranium producer in the world and the second biggest supplier of uranium to the U.S. market. Kazakhstan was able to increase production so rapidly by using something called “in situ leaching.”
Niger, Mali, Mongolia and Kazakhstan are all currently mining and selling uranium into the international market. They have very lax regulations which allow the in situ leaching mentioned above. It is a cheap method of separating uranium from ore. Toxic chemicals are pumped into uranium mines and uranium is processed from the run off of the leaching liquids. It can be very damaging to the environment and public health. A company spokesman for a uranium mining consultancy said, “Those are countries where their environmental institutions are very weak, their legislation is non-existent, so if you’re competing with in situ leaching in essentially low-governance areas of the world it’s going to be really, really hard.”
In the first years after the turn of the century, the prices for uranium rose. This was caused by declining stockpiles and the fact that interest in nuclear power was on the rise in the U.S. and in developing nations such as China and India. Energy Fuels and Ur-Energy were two private uranium companies that were started during this period. Both companies were started in Canada but they have uranium mines in the U.S. The CEO of Energy Fuels said “I would say at that time it was pretty frothy and in Canada particularly, there was just a lot of venture capital entering the uranium space for investment.”
In 2008, there was a global financial crisis that caused a reduction in the world-wide demand for electricity. During this same period, fracking technology was developed that resulted in a flood of cheap natural gas. This had an adverse impact on nuclear power plans. In addition to cheap natural gas, the rise in renewable energy sources such as solar and wind power made nuclear power even less competitive in the energy marketplace. In 2009, the Department of Energy began to sell excess uranium to pay for the cleanup of a federal uranium enrichment plant.
The nuclear disaster at Fukushima, Japan in March of 2011 caused a tremendous public rejection of nuclear power. Following the disaster, Japan shut down all of its nuclear power reactors. After eight years, they are just beginning to turn them back on. Germany decided to halt the use of nuclear power completely by 2022 and they have pursued the shutdown of their nuclear power reactors as planned in the intervening years.
Please read Part 3 -

Geiger Readings for Aug 10, 2018
Ambient office = 98 nanosieverts per hour
Ambient outside = 154 nanosieverts per hour
Soil exposed to rain water = 153 nanosieverts per hour
Crimini mushrooms from Central Market = 137 nanosieverts per hour
Tap water = 91 nanosieverts per hour
Filter water = 80 nanosieverts per hour
-
Nuclear Reactors 600 – History Of Uranium Production In The U.S. – 1 of 4 Parts
Part 1 of 4 parts
I have blogged before about uranium mining and the global uranium marketplace before. Today I thought I would dive more deeply into the uranium mining industry in the U.S.
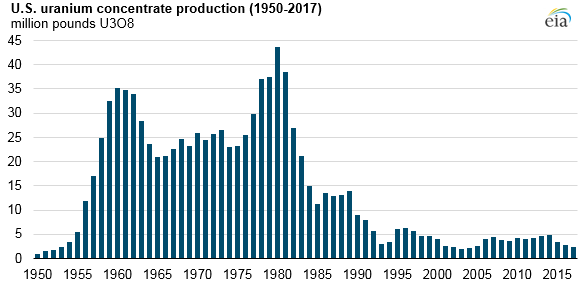
The U.S. uranium mining industry began around 1955 and flourished during the Cold War until about 1980. The U.S. had generous incentives for uranium mining because it was building up its nuclear arsenal during the Cold War. A uranium market analyst said, “It’s been government-sponsored, government-subsidized just since the beginning. Trying to sort that out and find where there’s a free market in uranium — I find that very questionable.”
The U.S. incentives included a ten -ear guarantee for the price that the federal government would pay for high-grade uranium ore. There was also a ten-thousand-dollar discovery and production bonus for each new ore deposit that was opened. Factoring in inflation since then, the bonus would be almost a hundred thousand dollars in today’s currency. These incentives triggered a uranium “gold rush” in the western states. As one analysist said, “It was crazy around this part of the country. Everyone with a jeep and a Geiger counter was out trying to get rich.”
During the 1960s, the federal government had filled warehouses with enough uranium stockpiles to the extent that the incentive program was not longer needed, and it was cancelled. However, there were rules that stayed in place against the import of foreign uranium until 1975. After that a growing percentage of foreign uranium entered the marketplace.
Inexpensive high-quality uranium ore came from deposits in Canada and Australia. By 1987, the U.S. was importing almost fifteen million pounds of uranium. Domestic production fell by a third to about thirteen million pounds. Although foreign competition did affect U.S. uranium production, the construction boom of commercial power reactors in the 1970s did keep U.S. mines in operation
The meltdown of a reactor at Three Mile Island in 1979 triggered a powerful backlash against nuclear power in the U.S. In 1986, the nuclear disaster at Cernobyl in Ukraine irradiated the country side and caused the permanent evacuation of a Ukrainian city. The U.S. love affair with nuclear power ground to a halt.
During this period, utilities were becoming concerned about the time and money necessary to license and construct nuclear power plants. Actual construction of nuclear power plants fell well below projections for the 1980s. This, in turn, depressed the market for uranium. When the last wave of nuclear power plants came on line in 1990, U.S. uranium production was at a thirty-
five year low.
Following the fall of the Soviet Union in 1991, it was revealed that the Soviets had been dumping cheap uranium ore onto the U.S. market prior to the breakup. The U.S. put restriction on the import of uranium ore from the old Soviet bloc countries in 1992 which provided some temporary relief for U.S. uranium miners. However, in 1993, the U.S, signed a contract for the Megatons to Megawatts program with Russia to buy five hundred tons of weapons-grade uranium. The high-grade uranium would be mixed with low grade ore to reduce the purity so that it could be made into nuclear fuel for U.S. power reactors. Over the next twenty years, this Russian uranium was used to supply about one third of the fuel for U.S. commercial nuclear power plants.
Please read Part 2 -

Geiger Readings for Aug 9, 2018
Ambient office =100 nanosieverts per hour
Ambient outside = 153 nanosieverts per hour
Soil exposed to rain water = 152 nanosieverts per hour
Carrot from Central Market = 118 nanosieverts per hour
Tap water = 96 nanosieverts per hour
Filter water = 80 nanosieverts per hour