There is a Google interactive map for monitoring the release radioactivity from accidents at nuclear power plants and other nuclear faclities. It was started after the Fukushima disaster to help people monitory the spread of radioactive materials from the destroyed reactors at Fukushima.
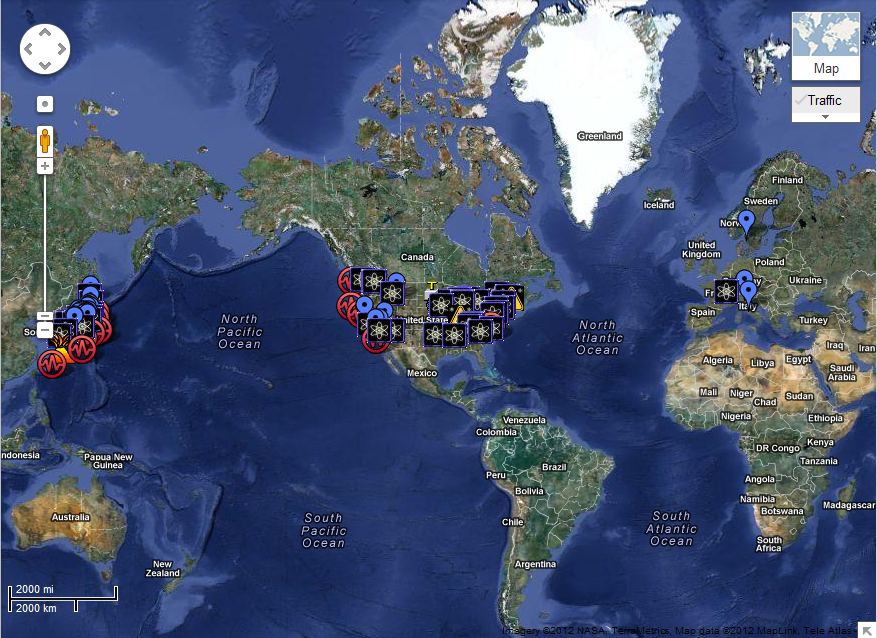
Most of the monitors are in Japan or the continental United States although there area few locations tagged in Europe.
There are four icons that used on the map.
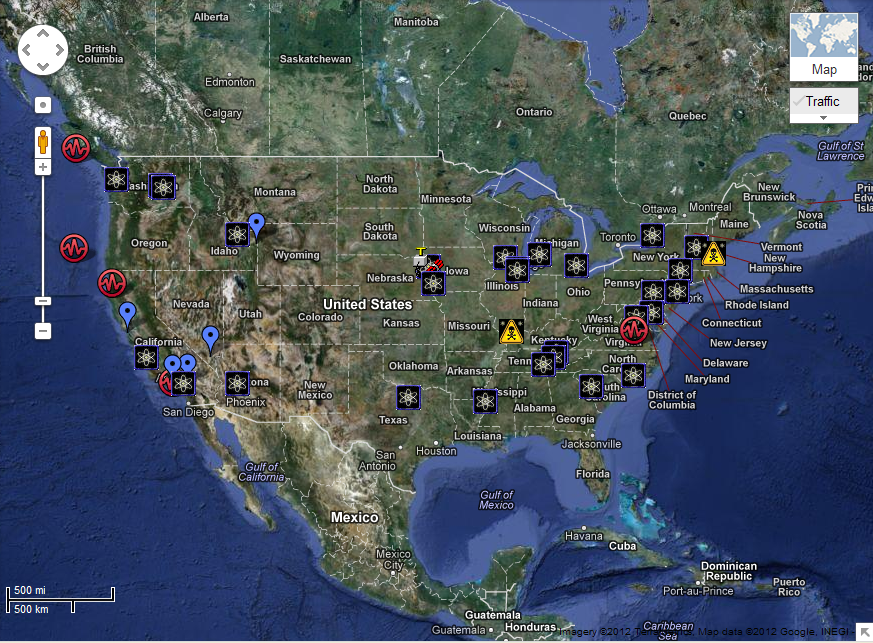
The atomic icon indicates a nuclear facility of some sort. When you click on an icon, a popup window shows the name of the facility and a list of recent incidents with the most recent at the top.
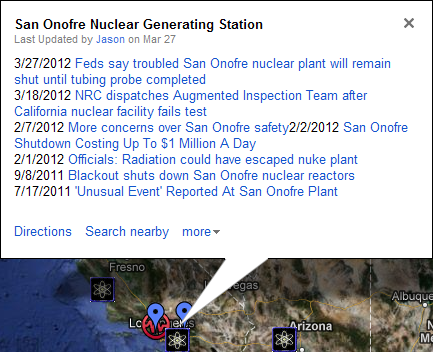
The box contains links that you can use to visit sites that reported the incidents.
The upside down blue teardrop icon indicates a radioactivity monitoring station. When you click on an icon, a popup box appears that identifies the monitoring station.
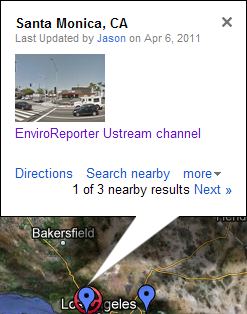
Some monitoring stations also provide a link to a live streaming video channel for the monitoring station.
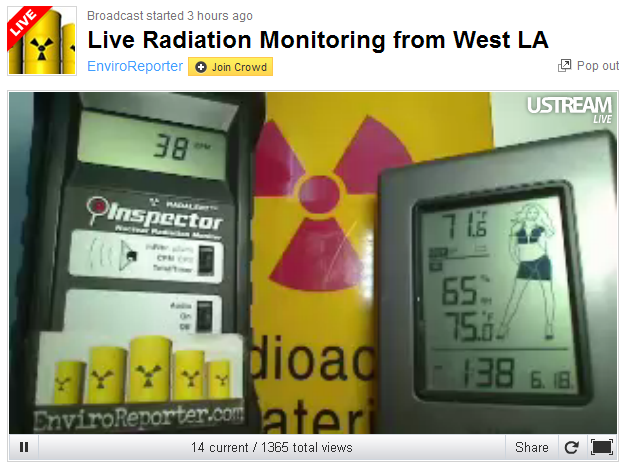
On the left of the display is the face of a handheld Geiger counter. The Inspector is the most sensitive pocket Geiger counter available. It has a large detector to increase sensitivity. The Inspector includes an output port that can send a real-time data feed to a computer. It can be set to display detected radiation in a number of different systems to units. The detection events shown in the picture above are in counter per minute. The display on the right shows the date, time, temperature, air pressure and humidity.
The wave form icon indicates the location of a recent earthquake.
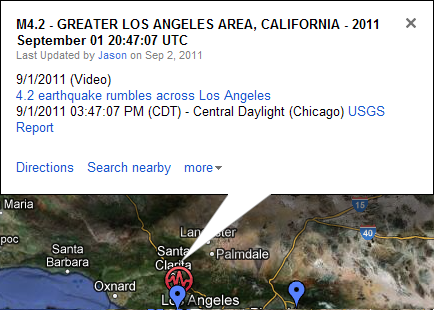
If you click on an icon, you get a popup box that gives you details on the earthquake. The tsunami that caused the flooding at Fukushima was triggered by a nearby earthquake. Another quake in the same area could drain the spent fuel pool at Fukushima Unit 4 and cause a world wide catastrophe. A number of other nuclear power plants in the world are located near active geological faults. Earthquakes are extremely relevant to the danger of major nuclear accidents.
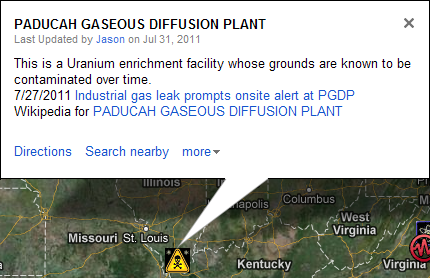
The skull and crossbones icon indicates the location of a recent radiological incident. When you click on an icon, a popup box gives you details on the incident. The volcano icon indicates the location of a volcano.

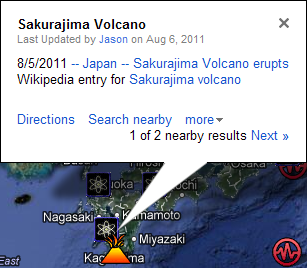
If you click on the icon, a popup box will appear that contains information about the volcano such as recent eruptions. There is also a link to a Wikipedia page about the volcano. Nuclear reactors near volcanoes are rare but they do exist and a major eruptions could lead to a serious nuclear accident.
The Google map page contains a list on the left side of the screen of all the different locations for facilities, monitors, earthquakes, major incidents and volcanoes that are displayed on the map. Google maps allow users to set up this kind of interactive maps for different purposes. They provide video tutorials that instruct users how to set up such maps