Part 2 of 3 Parts (Please read Part 1 first)
China’s solar and wind programs began in the mid-2000s and wind energy initially experienced much greater deployment. However, solar capacity deployments exceeded wind energy in both 2017 and 2018. This is part of the reason that solar deployments were on track to double China’s 2020 target for solar. Wind energy was only expected to hit one hundred and twenty five percent of the national target. Nuclear has been lagging set targets by a substantial amount and no one expects those targets to be reached. In 2019, there was a clear indication that China would meet substantially higher targets for wind and solar. At the same time China downgraded their expectations for nuclear installations. The new nuclear estimates were more accurate.
The rated capacity of a power generating source is one thing but it does not matter as much as actual recorded power generation. It turns out that wind energy in China as underperformed. A letter in the journal Environmental Research by European and North American researchers in 2018 assessed this situation.
“Our findings underscore that the larger gap between actual performance and technical potential in China compared to the United States is significantly driven by delays in grid connection (14% of the gap) and curtailment due to constraints in grid management (10% of the gap), two challenges of China’s wind power expansion covered extensively in the literature. However, our findings show that China’s underperformance is also driven by suboptimal turbine model selection (31% of the gap), wind farm siting (23% of the gap), and turbine hub heights (6% of the gap)—factors that have received less attention in the literature and, crucially, are locked-in for the lifetime of wind farms.”
Some of the capacity factor issues would be difficult to change while other might be ameliorated. Overall, the Chinese wind energy real capacity is well below that of the U.S. fleet of wind generators. Solar is less susceptible to some of the problems that impeded wind energy generation. China’s nuclear fleet has done much better in its ability to connect to the grid. Since the reactors are new, they are not being taken offline for substantial maintenance yet. The average capacity factor for the nuclear fleet of ninety one percent is used.
Even adjusted for the poor capacity factor’s wind experienced and the global capacity factor for nuclear, there was no year when the nuclear fleet added more actual generation than wind energy. With respect to solar versus nuclear power generation, on once in the past five years was more annual power generation added by the nuclear program than the solar program. The Chinese wind and solar deployment programs were started well over a decade after the beginning of the nuclear program. The first nuclear reactor was connected to the Chinese national power grid in 1994.
China has made a major commitment to nuclear power and there has been mention in Chinese press of plans to deploy hundreds of new nuclear reactors in the next decade. It is doubtful that this will come to pass.
Please read Part 3 next
Blog
-

Nuclear Reactor 946 – Comparison of China’s Wind – Solar – Nuclear Power Scalability – Part 2 of 3 Parts
-
Nuclear News Roundup Sep 07, 2021
Iodide tablets offered as precaution to residents living near nuclear plants wfmz.com
Israel’s military chief says ‘accelerating’ Iran strike plans Aljazeera.com
IAEA Supports Strengthening of Regional Collaboration on Nuclear Security iaea.org
Components for Summer headed to Ukraine world-nuclear-news.org
-
Geiger Readings for Sep 07, 2021
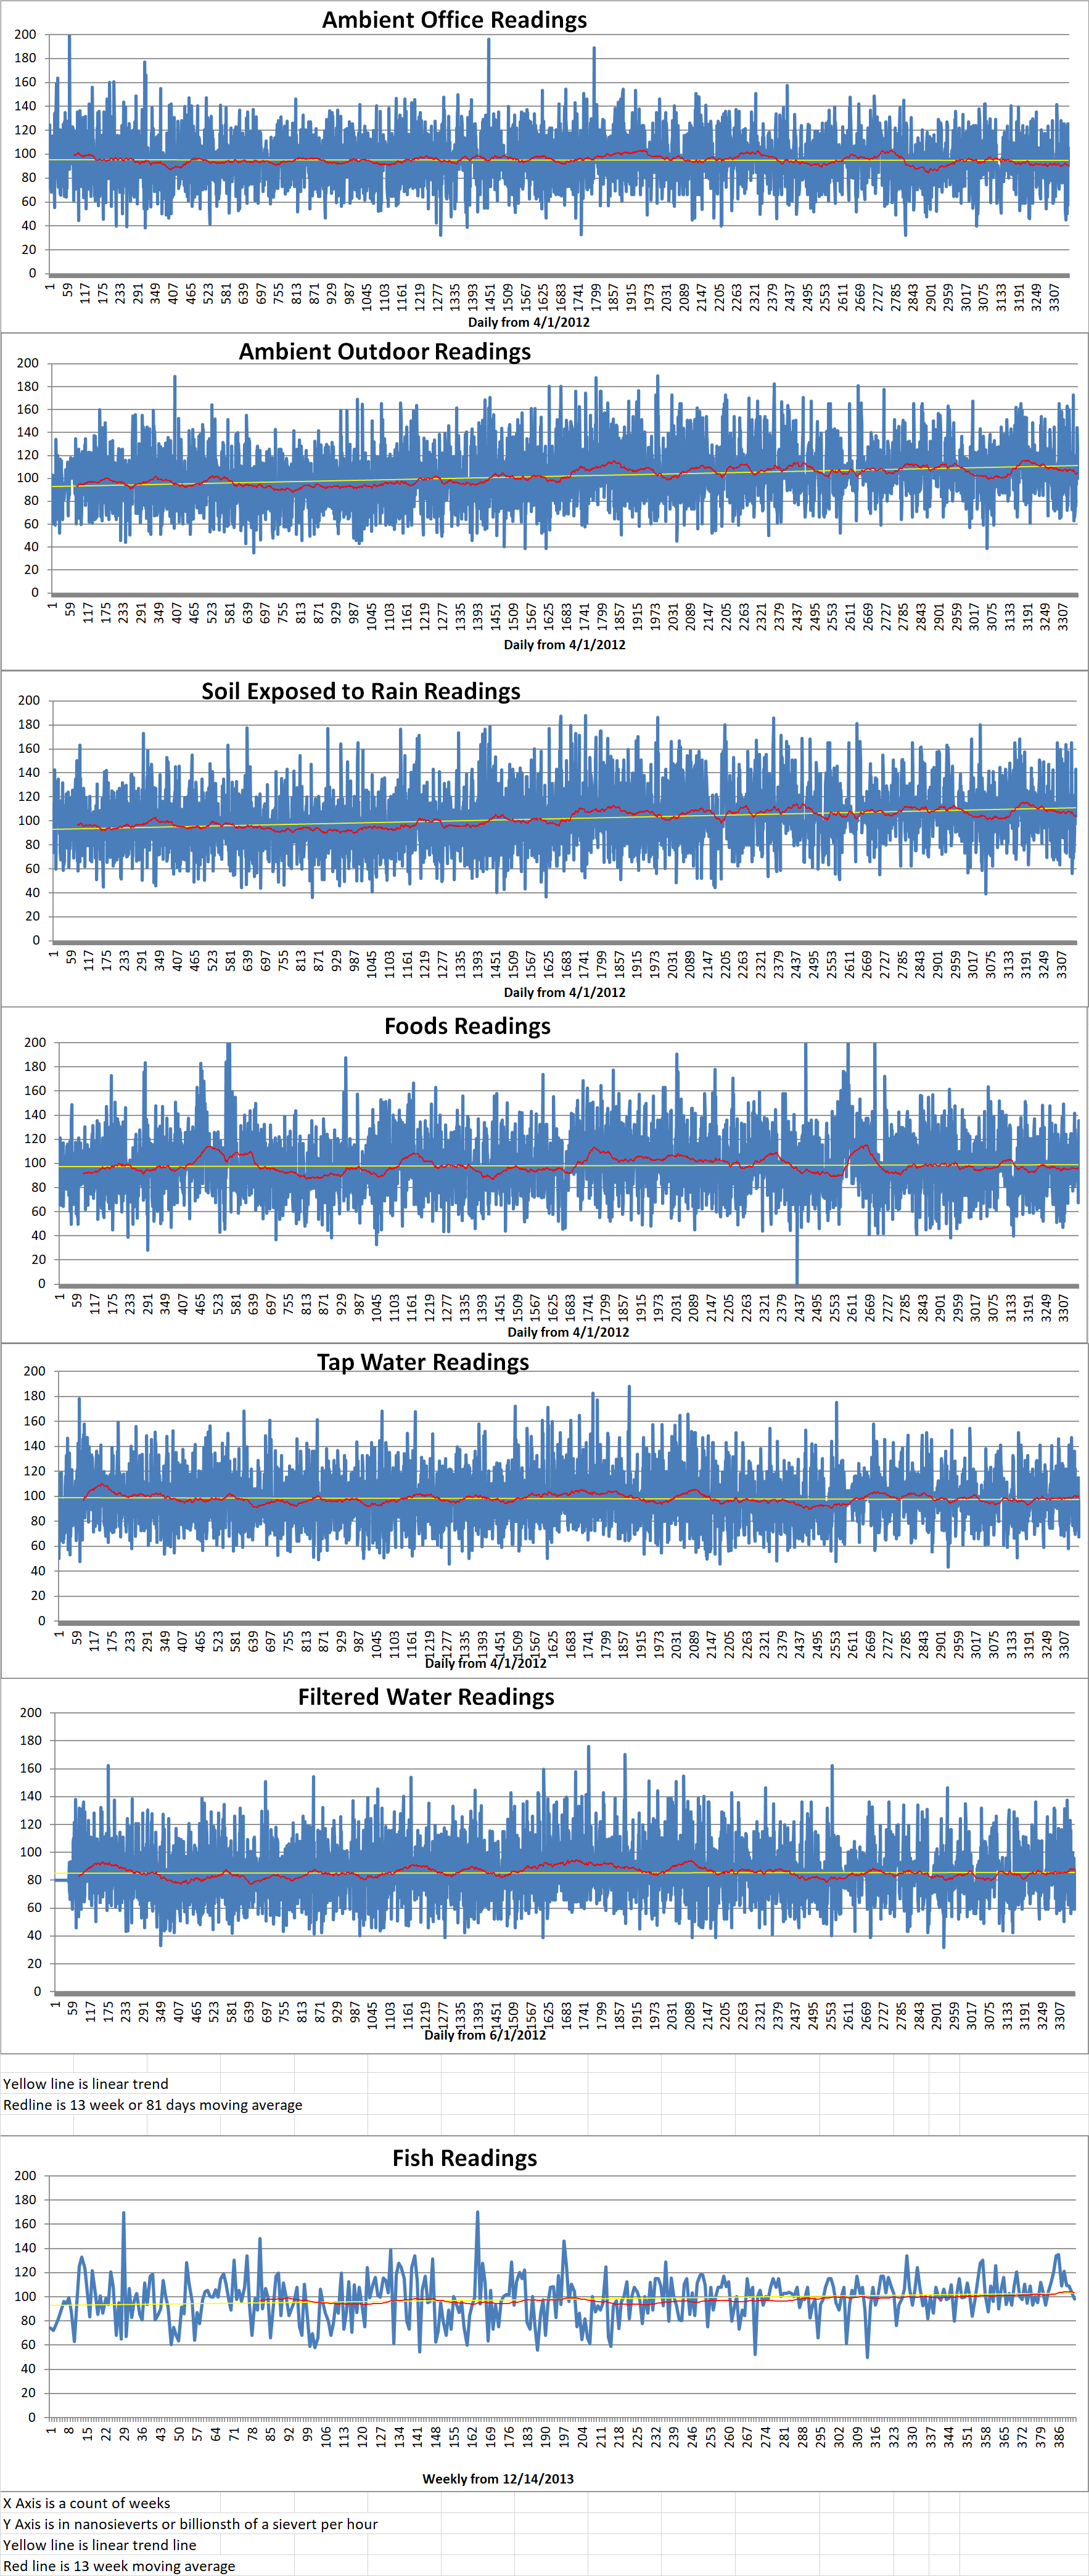
Ambient office = 105 nanosieverts per hour
Ambient outside = 100 nanosieverts per hour
Soil exposed to rain water = 104 nanosieverts per hour
Avocado from Central Market = 135 nanosieverts per hour
Tap water = 96 nanosieverts per hour
Filter water = 87 nanosieverts per hour
-
Nuclear Reactor 945 – Comparison of China’s Wind – Solar – Nuclear Power Scalability – Part 1 of 3 Parts
Part 1 of 3 Parts
Scalability is a term that refers to the ability of application of a particular technology to be expanded. Different forms of energy generation vary with respect to scalability. An analyst made a study of China’s development of different types of energy sources back in 2014. The analyst concluded that a comparison of China’s expansion of wind power and nuclear power clearly showed that wind power was more scalable. In 2019, the same analyst conducted a review of the relative sustainability of wind power, solar power and nuclear power. He concluded that wind and solar were outperforming nuclear sustainability in total annual power generation. He estimated that by 2030, wind and solar sources would be producing four times the energy of nuclear sources.
The analyst stands by his assertion on the scalability of deployment. There are massive economics of scale involved in the manufacture and distribution of wind and solar components and massive parallelization of construction that is possible with wind and solar installations. These combined advantages of wind and solar power generation will always make them faster and easier to scale in capacity and generation than huge nuclear power generation by gigawatt reactors.
China is the perfect natural experimental environment for such studies because wind, solar and nuclear are being treated as national priorities. Nuclear can only succeed with major national support. In totalitarian China, the national government can override any contrary local regulations and any local opposition to an energy installation. No other country in the world could be such a useful laboratory in which to assess which energy generating technologies can be deployed more quickly.
Every year, the World Wind Energy Association publishes reports by industry analysts on global wind energy developments in different geographic areas. The 2020 report was focused on the impact of the Covid 19 pandemic on the global wind energy industry. The report for the USA and Canada in March of 2021 focused on the force majeure section of wind construction contracts. (Force majeure involves the inability of a company to fulfill a contract due to unforeseen circumstances such as hurricanes and earthquakes.) The report predicted that in 2020, the wind installations would be slowed by force majeure events and companies would miss expectations. This turned out to be the case for the U.S., Canada and most other countries around the globe.
China bucked the trend. In 2020, they deployed seventy-two gigawatts of wind energy which was much more than expected. They also deployed forty-eight gigawatts of solar power. The wind deployment in China was a global record. The solar deployment was more than fifty percent greater than 2019. With respect to nuclear power, no nuclear reactors were commissioned in 2020. The added additional capacity was documented by multiple sources including World Nuclear Association, the Global Wind Energy Council, and the International Energy Agency’s photovoltaic material. From 2010 to 2020, there were only three years when China connected no nuclear power reactors to the national grid. It intends to add more this year.
Please read Part 2 next -
Nuclear News Roundup Sep 06, 2021
Energy Markets Bet Against Nuclear As Election Nears In Japan finance.yahoo.com
Penn State nuclear engineering to open new collaboration, learning space news.psu.edu
South Korea develops submarine-launched missile often used to carry nuclear warheads news.yahoo.com
Protests as France sends latest nuclear shipment to Japan france24.com
-
Geiger Readings for Sep 06, 2021
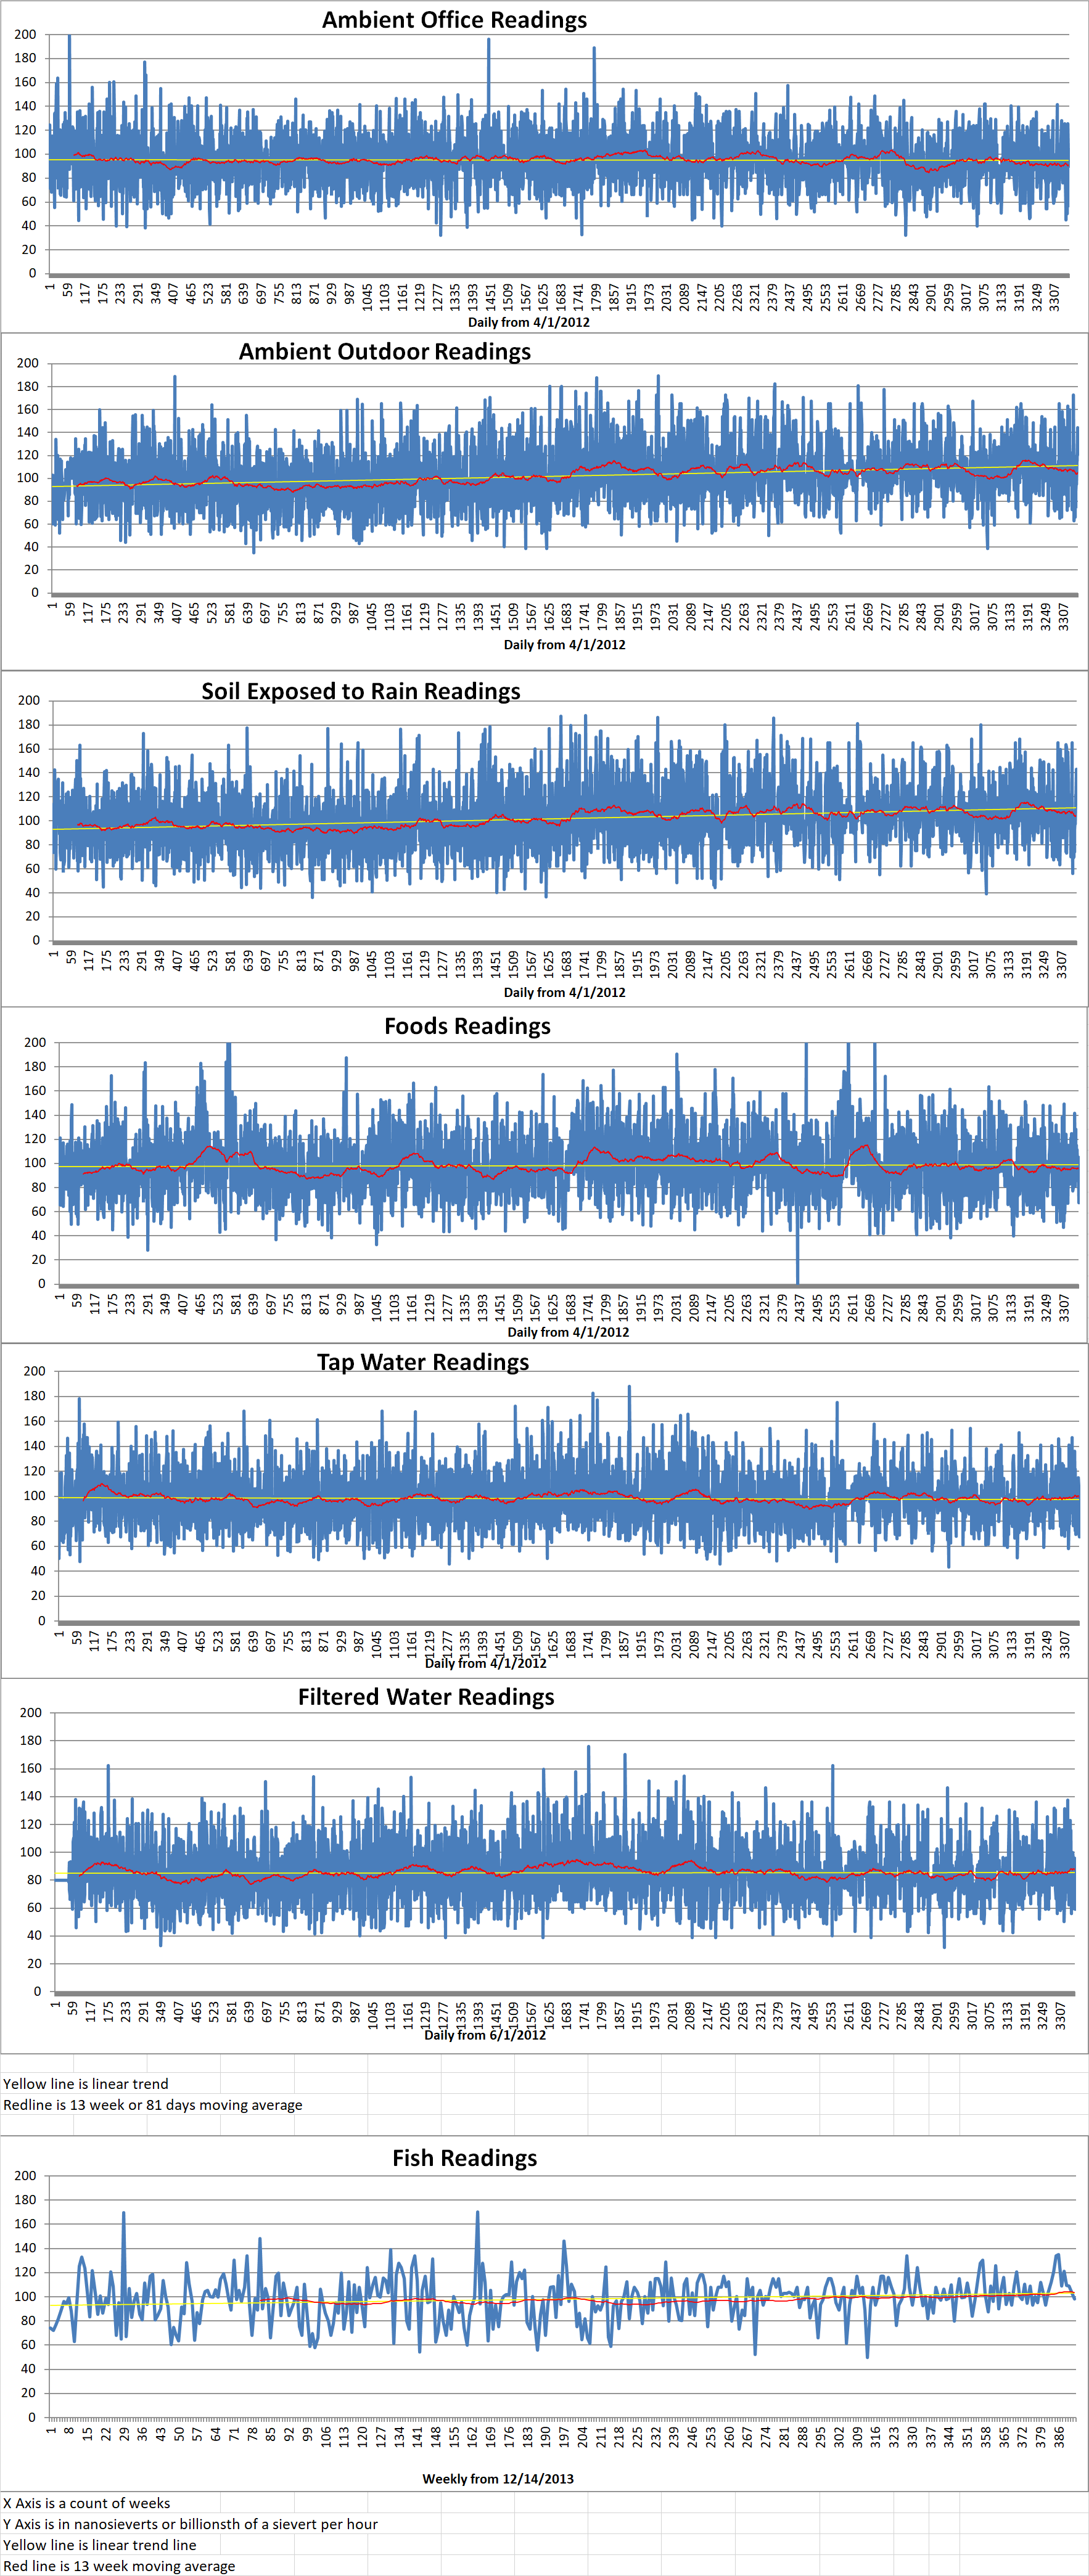
Ambient office =90 nanosieverts per hour
Ambient outside = 121 nanosieverts per hour
Soil exposed to rain water = 119 nanosieverts per hour
Broccoli from Central Market = 67 nanosieverts per hour
Tap water = 67 nanosieverts per hour
Filter water = 59 nanosieverts per hour
-
Nuclear News Roundup Sep 05, 2021
US, Germany press for Iran to return soon to nuclear talks abc17news.com
Texas Legislature votes against nuclear waste dumping in rare bipartisan agreement ktsm.com
Moscow flexes muscle in Arctic region with nuclear icebreaker fleet wionews.com
Will Japan’s next premier support a nuclear-free world? Ucanews.com
-
Geiger Readings for Sep 05, 2021
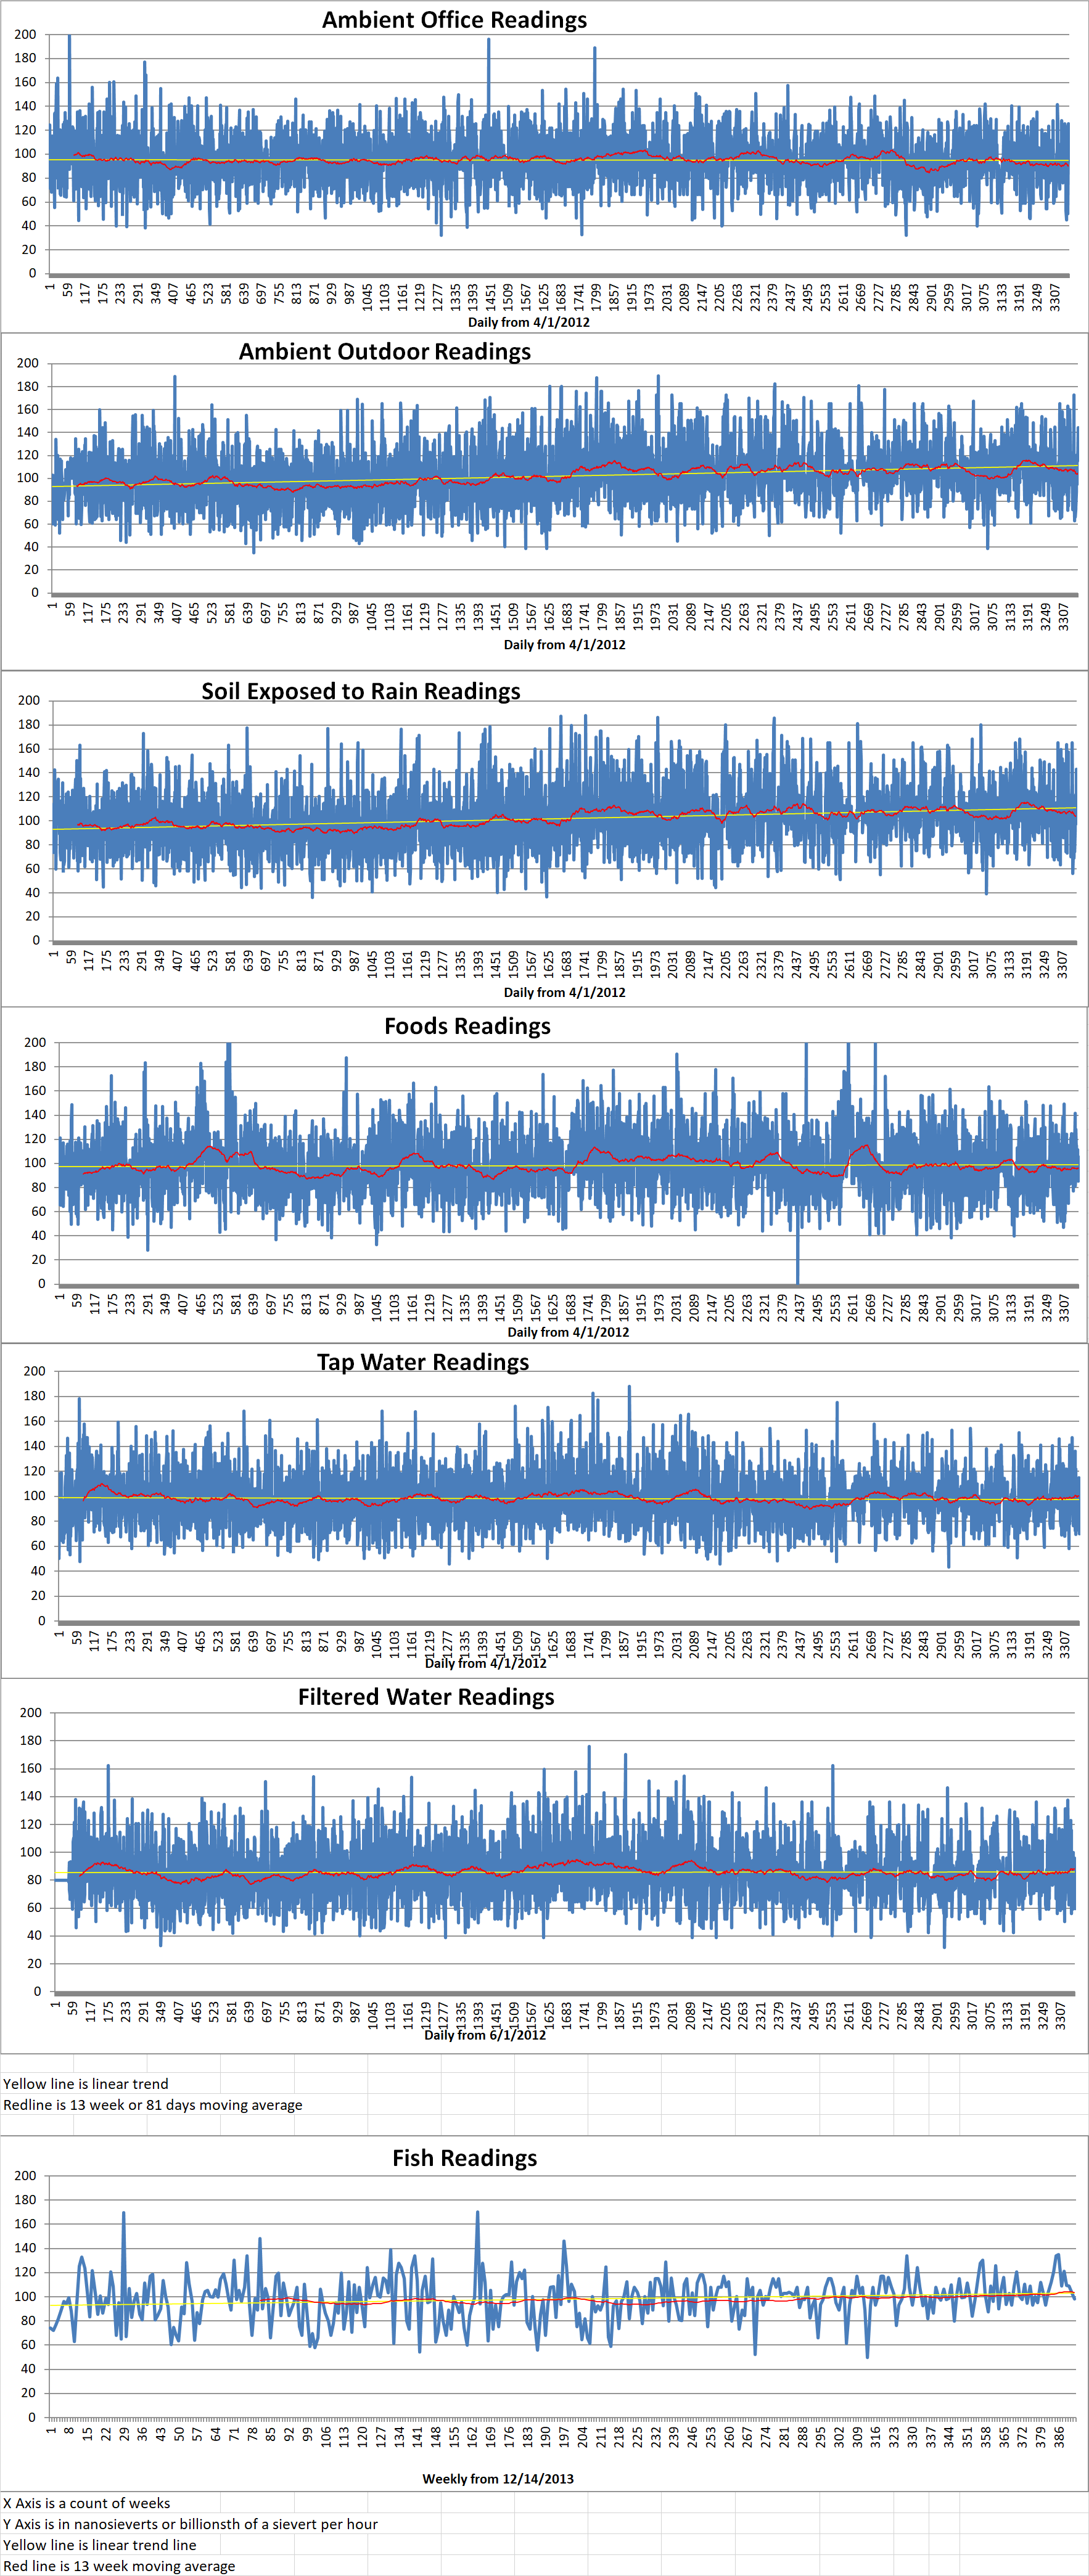
Ambient office = 99 nanosieverts per hour
Ambient outside = 144 nanosieverts per hour
Soil exposed to rain water = 143 nanosieverts per hour
Green bell pepper from Central Market = 105 nanosieverts per hour
Tap water = 70 nanosieverts per hour
Filter water = 60 nanosieverts per hour
-
Nuclear News Roundup Sep 04, 2021
IAEA launches review of Fukushima water release world-nuclear-news.org
Daya Bay experiment fully decommissioned world-nuclear-news.org
Viewpoint: Demonstration AND test reactors: both are necessary for innovation world-nuclear-news.org
US, Norway work together to eliminate HEU world-nuclear-news.org
-
Geiger Readings for Sep 04, 2021
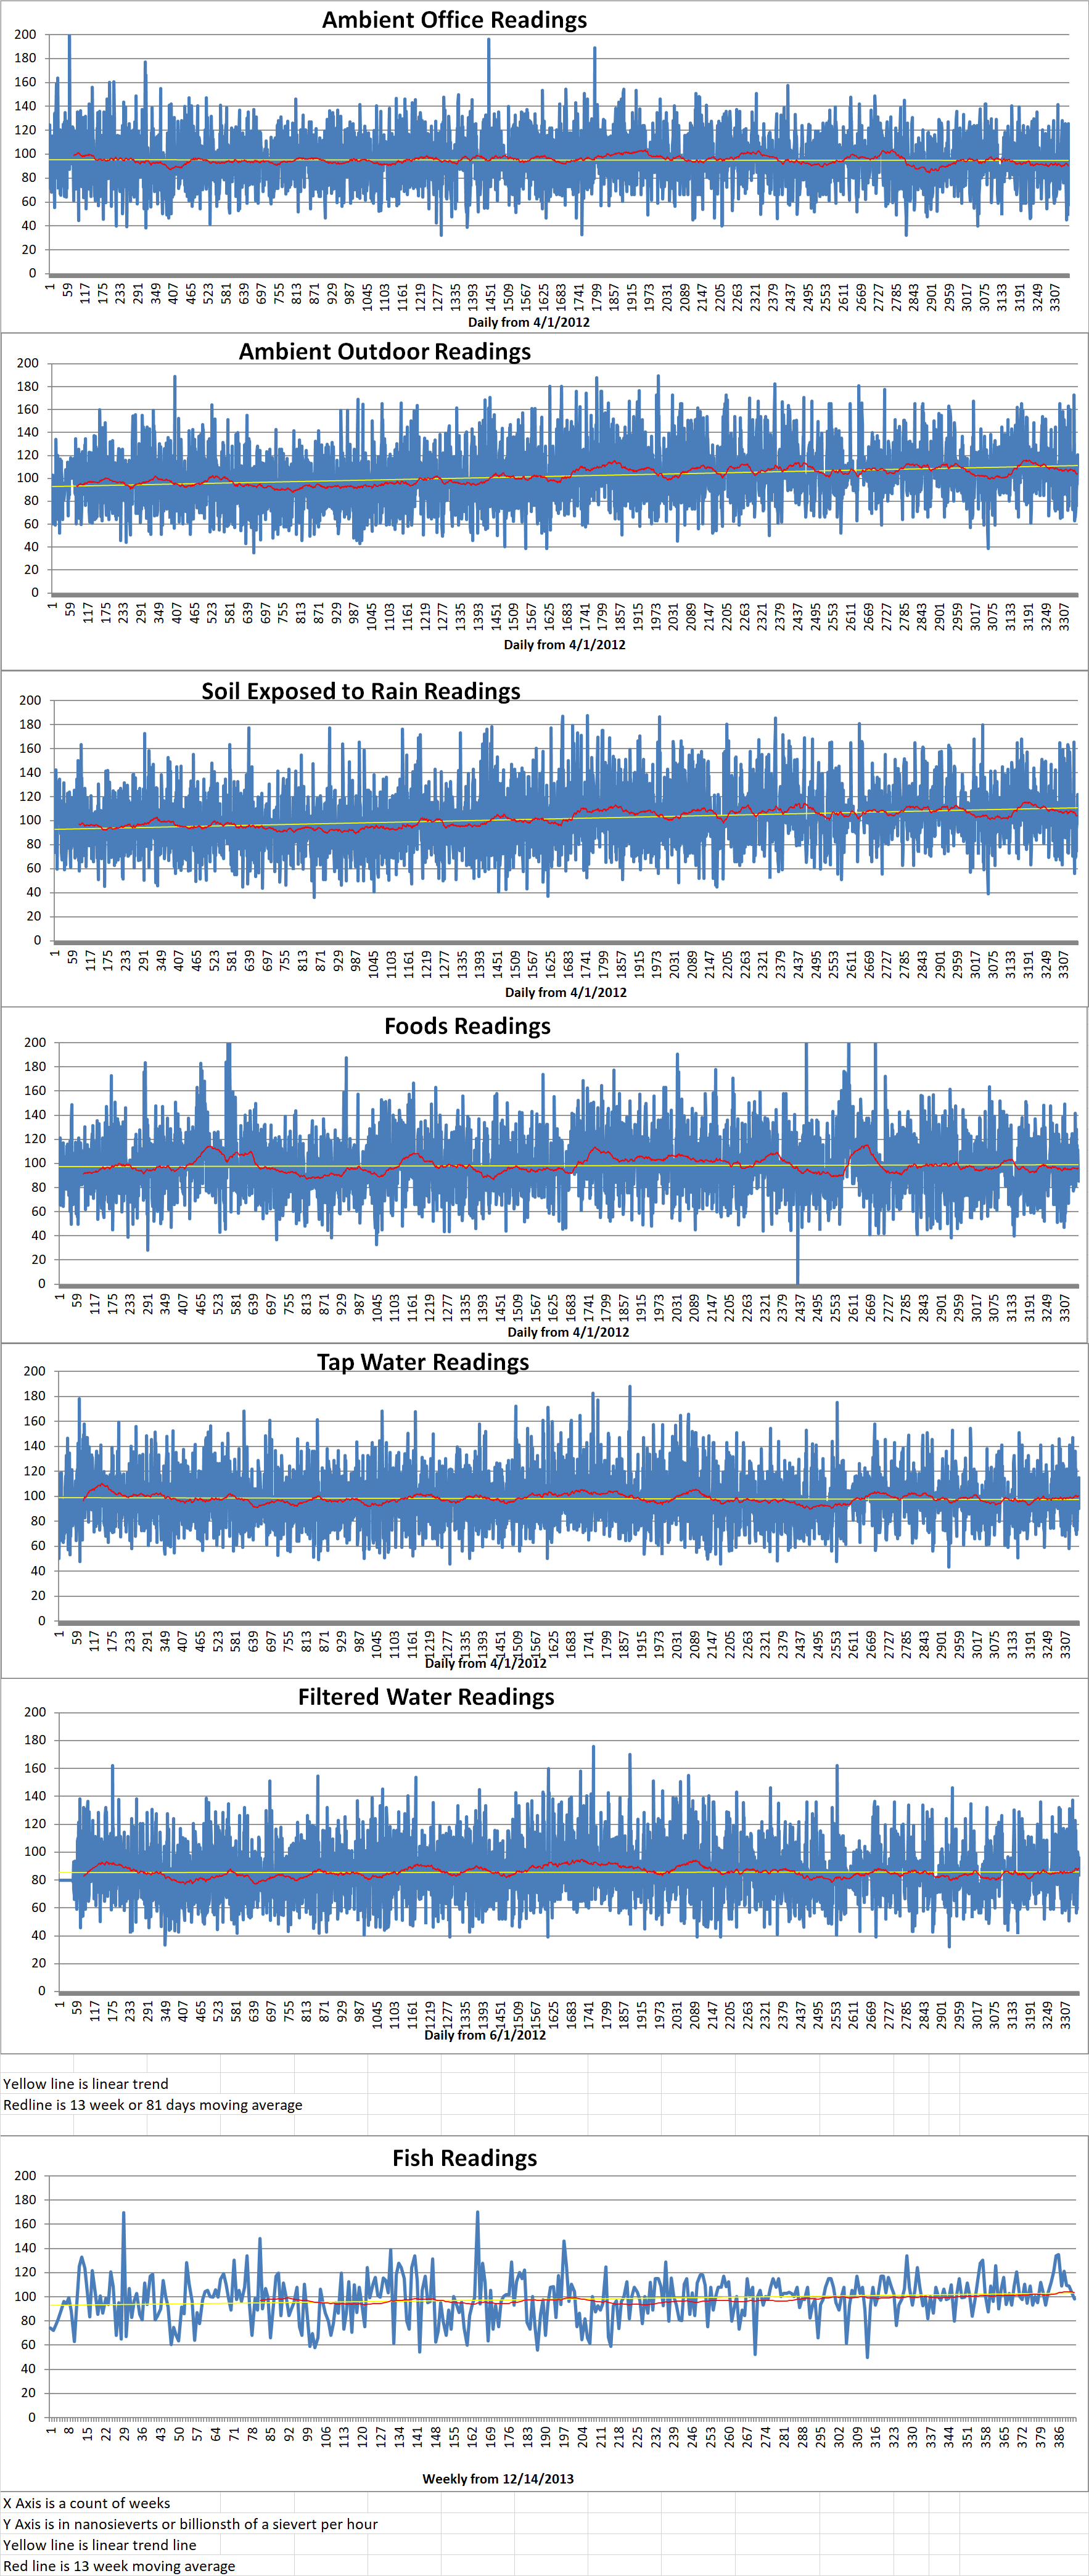
Ambient office = 93 nanosieverts per hour
Ambient outside = 115 nanosieverts per hour
Soil exposed to rain water = 15 nanosieverts per hour
Peach from Central Market = 85 nanosieverts per hour
Tap water = 106 nanosieverts per hour
Filter water = 963 nanosieverts per hour
Dover sole – Caught in USA = 103 nanosieverts per hour